Cybergarden Calendar
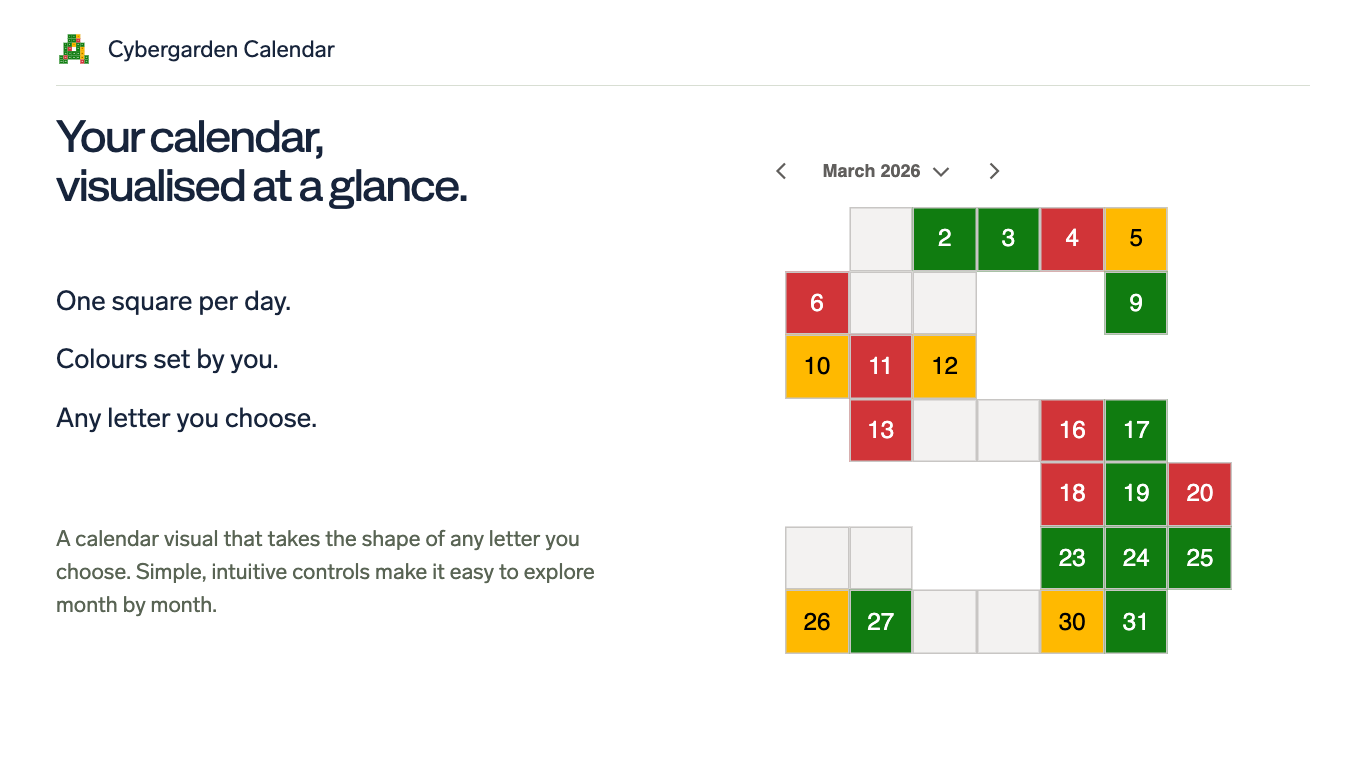
Your calendar, visualised at a glance. One square per day, colours set by you, and any letter you choose.
Free · AppSource review in progress
About Cybergarden Calendar
Turn dates in your Power BI report into a monthly display of equal square cells. Choose a square grid or any letter from A to Z. Set daily colours using your own rules, gradients or measures.
Built for dashboard authors and operations teams tracking daily status. Place several calendars together to create a Safety, Quality, Delivery, Cost and People (SQDCP) board.
A month of status in one view
- Browse whole months with previous/next arrows or the month and year picker.
- Keep your layout when filtering. Days without matching data remain empty grey squares in the same positions.
- Resize a letter to fit your report while keeping every day cell square. Shorter months and leap years retain the outline.
- Use report-provided data and Power BI conditional formatting. The visual processes data locally, without external requests or telemetry.
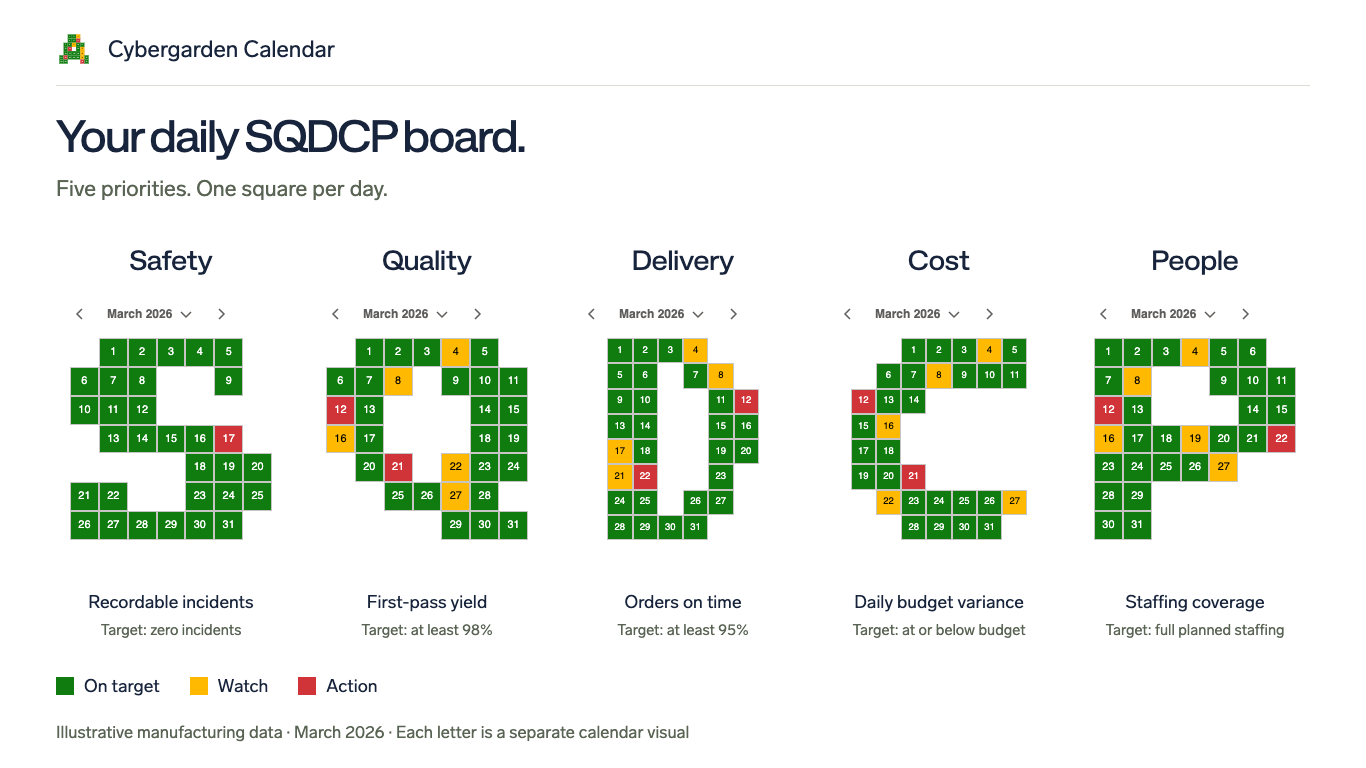
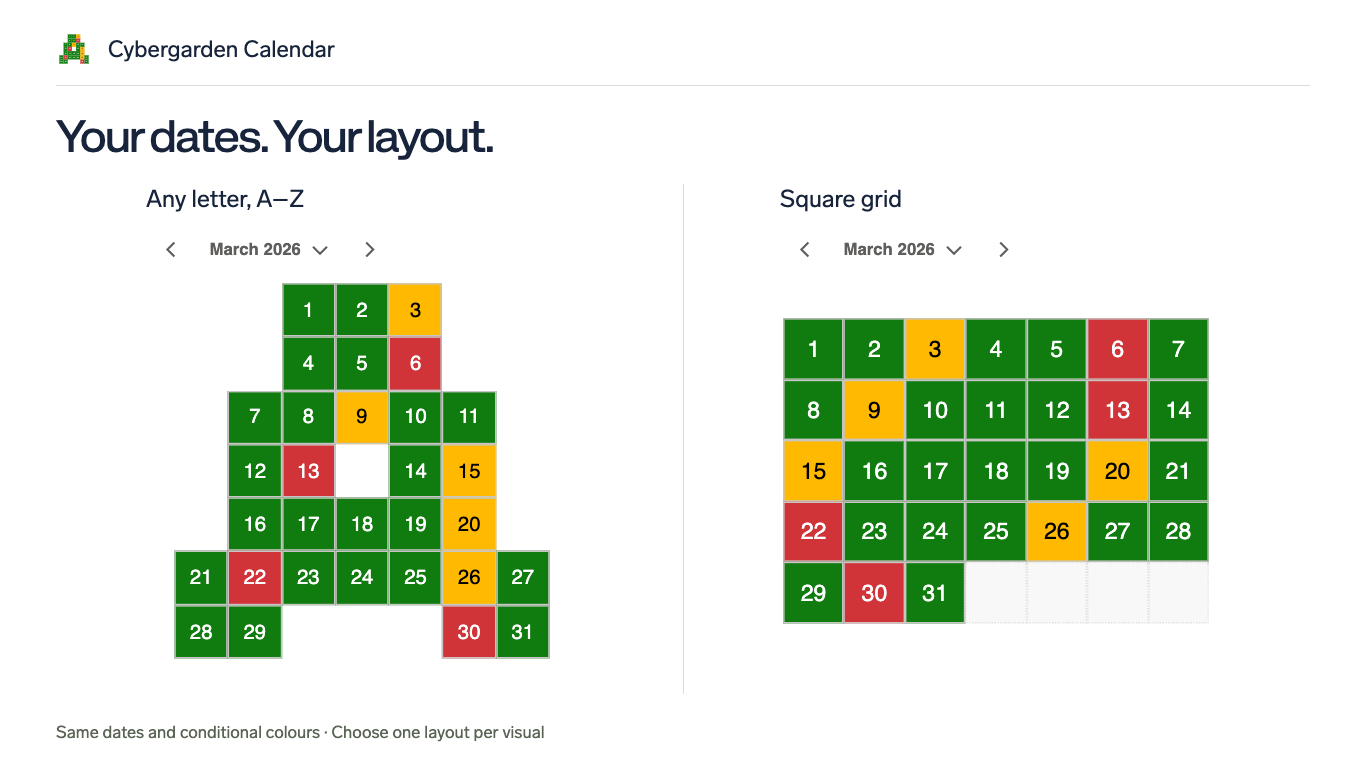
Screenshots use illustrative data. Select an image to view it at full size.
Where to start
Add a raw Date or Date/Time column to the visual. Choose a month in its header, then select Square grid or Letter in the Calendar settings. Use Box fill → fx to set your daily colours.
The grid runs in day-number order rather than weekday columns. Month navigation changes this visual only; it does not restore dates excluded by report filters. Clicking a day does not filter other visuals. For more than 30,000 date categories, filter your report to the period you need.
Availability and support
Cybergarden Calendar is free, with no in-app purchases or separate account. The first release has been submitted to Microsoft AppSource and is awaiting review. Contact us for product or setup questions.
Ask about Cybergarden CalendarNeed help configuring a system, connecting software or building an internal tool? Explore our services.
Explore services